Pratiman Patel, 10 August 2021
2 min read.Colormaps is a library of collection of colormaps or color palettes for Python. It’s written in Python with matplotlib and numpy as dependencies. You can use Colormaps to customize matplotlib plots.
Colormaps has colormaps or color palettes from:
may be moreFor latest documentation, please visit: https://pratiman-91.github.io/colormaps/
Python with:
git clone https://github.com/pratiman-91/colormaps.git
cd colormaps
python setup.py install
Colormaps are pre-built and loaded at the time of importing.
import colormaps as cmaps
cmaps.drought_severity

cmaps.ice

cmaps.ice.discrete(10)

cmaps.ice.shift(0.5)

cmaps.ice.shift(0.5).discrete(10)

cmaps.ice.discrete(11).cut(0.25, 'left')

from colormaps.utils import concat
concat1 = concat(["cmocean_ice", "BkBlAqGrYeOrReViWh200"])

from colormaps.utils import concat
concat2 = concat([cmaps.cmocean_ice, cmaps.BkBlAqGrYeOrReViWh200], ratios=[0.25,0.75])

import matplotlib.pyplot as plt
import colormaps as cmaps
import numpy as np

x = y = np.arange(-3.0, 3.01, 0.05)
X, Y = np.meshgrid(x, y)

sigmax = sigmay = 1.0
mux = muy = sigmaxy=0.0

Xmu = X-mux
Ymu = Y-muy

rho = sigmaxy/(sigmax*sigmay)
z = Xmu**2/sigmax**2 + Ymu**2/sigmay**2 - 2*rho*Xmu*Ymu/(sigmax*sigmay)
denom = 2*np.pi*sigmax*sigmay*np.sqrt(1-rho**2)
Z = np.exp(-z/(2*(1-rho**2))) / denom

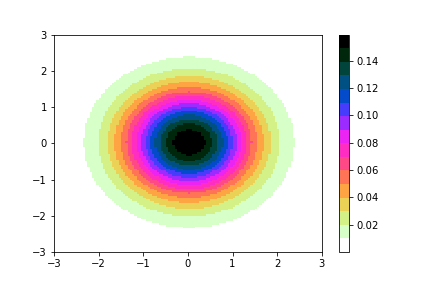
plt.pcolormesh(X,Y,Z,cmap=cmaps.cubehelix3_16_r)
plt.colorbar()
