Pratiman Patel, 29 October 2020
1 min read.This is just for my understanding. I tend to forget things. Might be useful to others as well.
# Importing stuff
import imdlib as imd
import geopandas
from shapely.geometry import mapping
import rioxarray as rio
# Downloading 30 years of rainfall data for India
start_yr = 1990
end_yr = 2019
variable = 'rain' # other options are ('tmin'/ 'tmax')
imd.get_data(variable, start_yr, end_yr, fn_format='yearwise')
# Loading the downloaded data
data = imd.open_data(variable, start_yr, end_yr,'yearwise')
ds = data.get_xarray()
#Define lat/long
pr = ds.rio.set_spatial_dims('lon', 'lat')
pr = pr.rio.set_crs("epsg:4326")
# Get the shapefile to be extracted
sf = geopandas.read_file(r'Try.shp')
# Extract/mask from the shapefile
clipped = pr.rio.clip(sf.geometry.apply(mapping), sf.crs, all_touched=True)
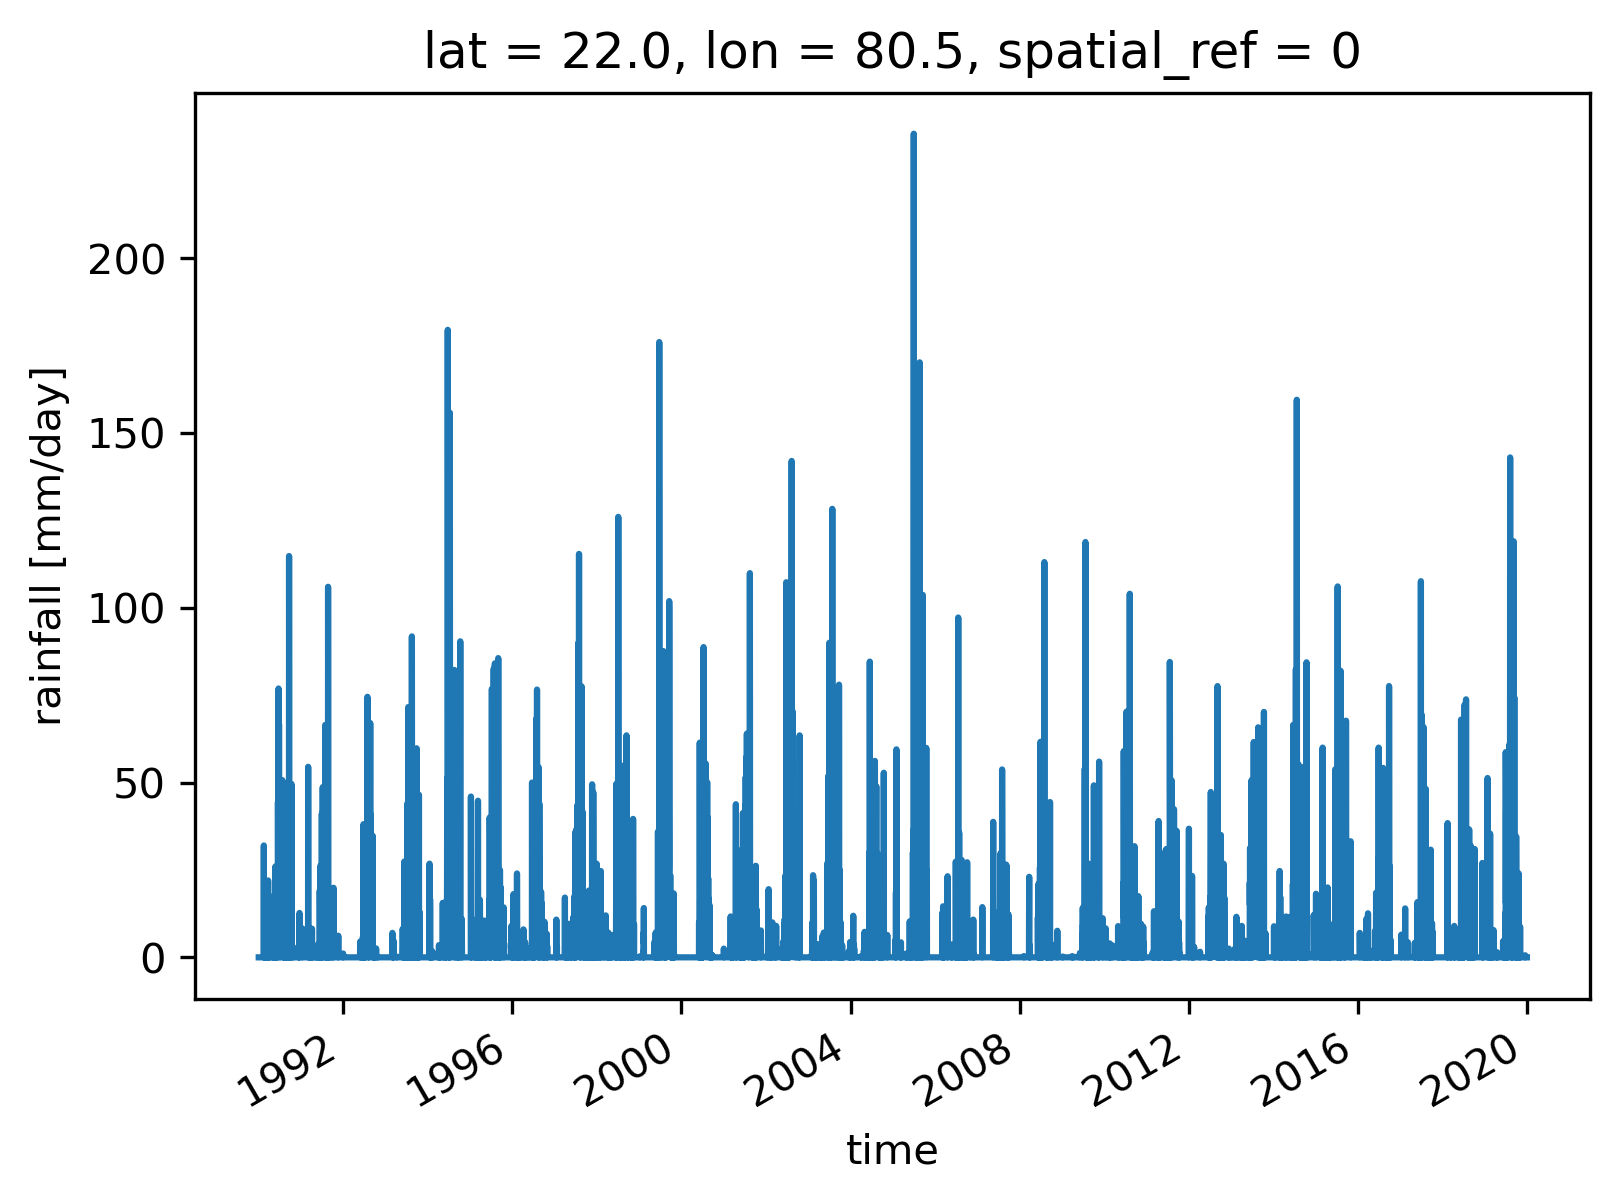
# Check for the values
clipped[1,1,:].plot()
# Save to file in NetCDF format
save_nc = (r'C:\Users\imdlib\Desktop\IMD_Rain_Clipped.nc')
clipped.to_netcdf(save_nc)