
Pratiman Patel, 07 October 2020
2 min read.This is intended for those who have never used python or just starting to work in python. Here are the steps which will help them with getting started with IMDLIB and Python.
There are multiple options you can choose for Python distribution. I like the use of miniconda which is light weight and does not come with unnecessary libraries.
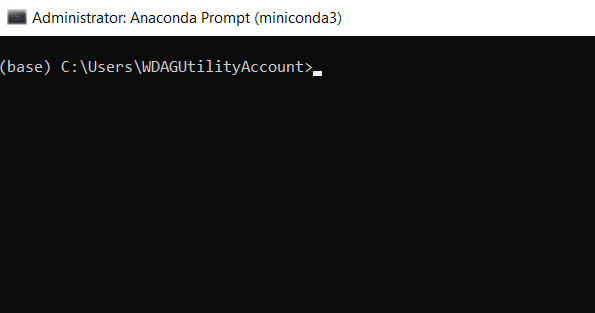
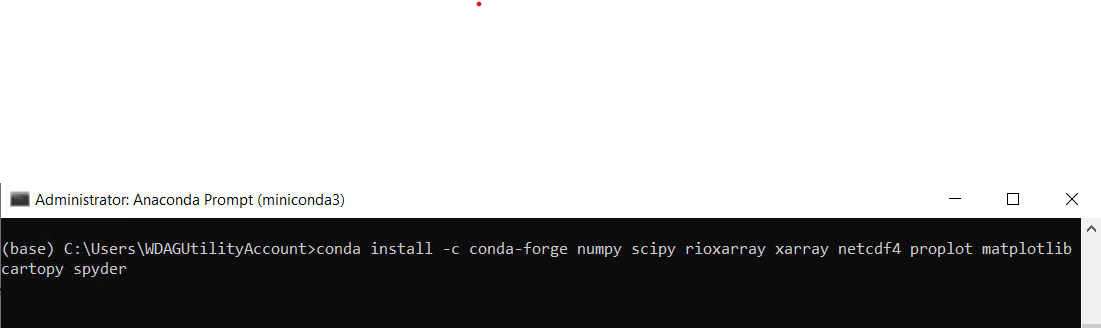
conda install -c conda-forge numpy scipy rioxarray xarray netcdf4 proplot matplotlib cartopy spyder
pip install imdlib
Collecting package metadata (current_repodata.json): done
Solving environment: failed with initial frozen solve. Retrying with flexible solve.
Solving environment: failed with repodata from current_repodata.json, will retry with next repodata source.
Collecting package metadata (repodata.json): done
Solving environment: done
...
...
...
Proceed ([y]/n)? y
...
...
...
Preparing transaction: done
Verifying transaction: done
Executing transaction: done
You might get extra warnings. You can ignore them.
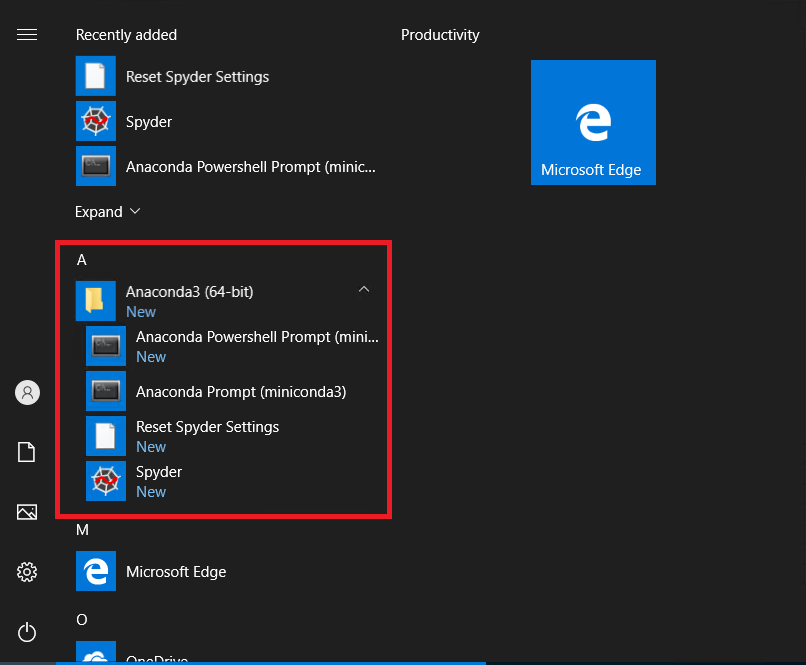
Open Spyder.
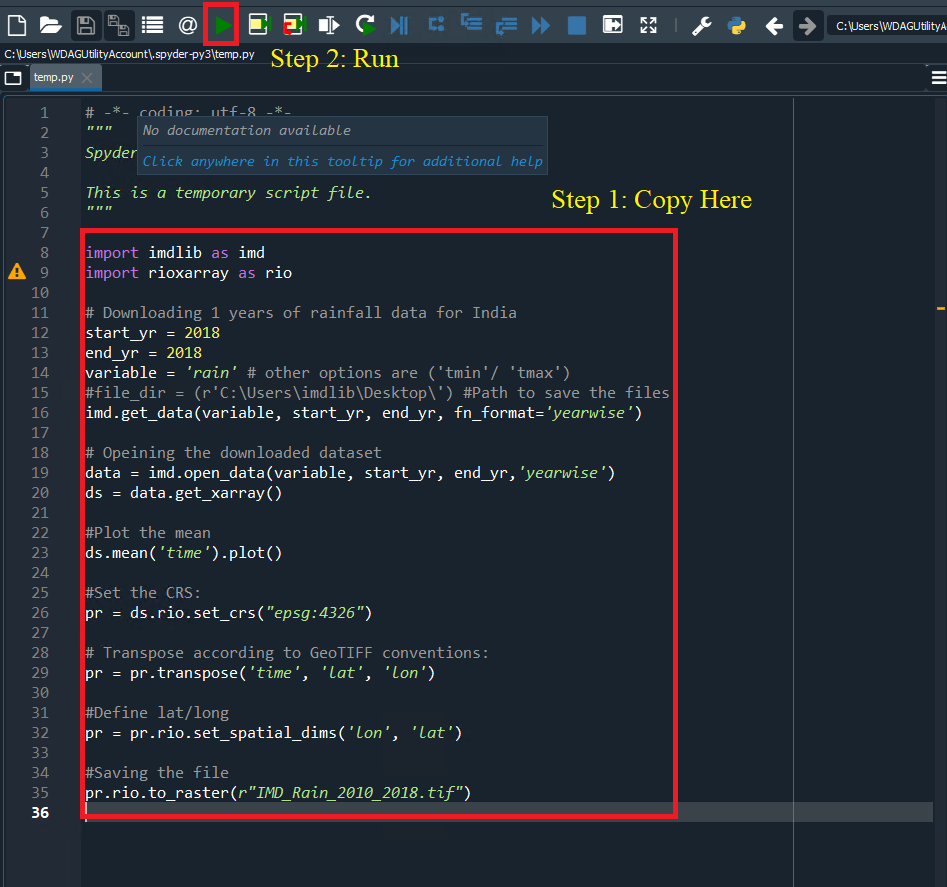
Test your first imdlib code. Copy the following code to the to editor window of the spyder and run.
import imdlib as imd
import rioxarray as rio
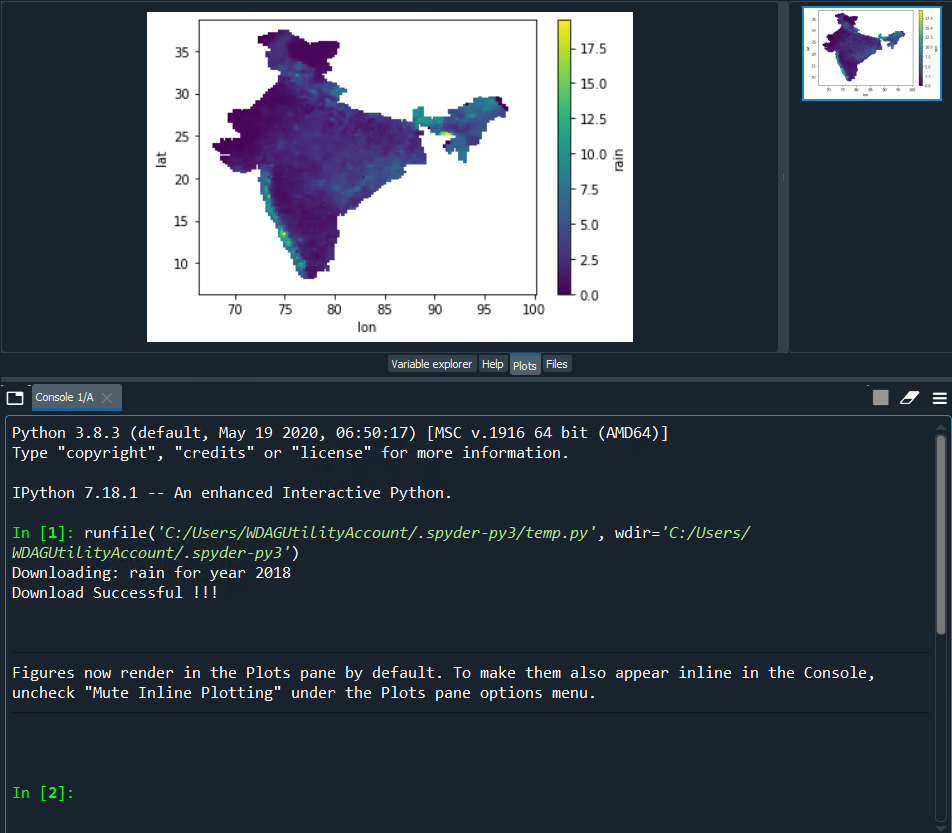
# Downloading 1 years of rainfall data for India
start_yr = 2018
end_yr = 2018
variable = 'rain' # other options are ('tmin'/ 'tmax')
#file_dir = (r'C:\Users\imdlib\Desktop\') #Path to save the files
imd.get_data(variable, start_yr, end_yr, fn_format='yearwise')
# Opeining the downloaded dataset
data = imd.open_data(variable, start_yr, end_yr,'yearwise')
ds = data.get_xarray()
#Plot the mean
ds.mean('time').plot()
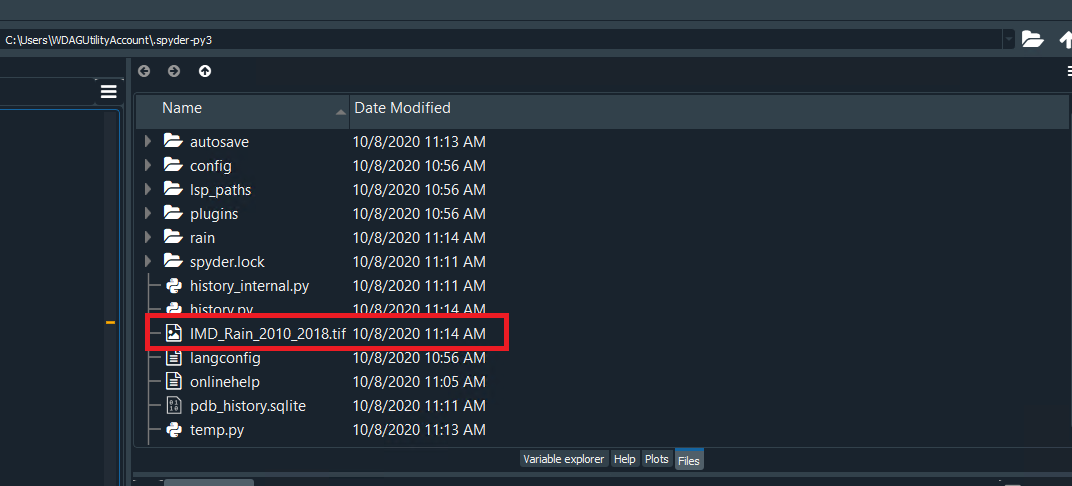
#Set the CRS:
pr = ds.rio.set_crs("epsg:4326")
# Transpose according to GeoTIFF conventions:
pr = pr.transpose('time', 'lat', 'lon')
#Define lat/long
pr = pr.rio.set_spatial_dims('lon', 'lat')
#Saving the file
pr.rio.to_raster(r"IMD_Rain_2010_2018.tif")
Welcome to the world of Python!