
Saswata Nandi and Pratiman Patel, 05 October 2020
3 min read.For latest documentation, please visit https://imdlib.readthedocs.io/en/latest/
IMDLIB is a python package to download and handle binary grided data from India Meteorological Department (IMD). For more information about the IMD datasets, follow the following link: http://imdpune.gov.in/Clim_Pred_LRF_New/Grided_Data_Download.html
IMDLIB can be installed via pip. It is tested for both Windows and Linux platforms with 64-bit architecture only.
pip install imdlib
IMDLIB is capable of downloading gridded rainfall and temperature data (min and max). Here is an example of downloading rainfall dataset from 2010 to 2018.
import imdlib as imd

# Downloading 8 years of rainfall data for India
start_yr = 2010
end_yr = 2018
variable = 'rain' # other options are ('tmin'/ 'tmax')
imd.get_data(variable, start_yr, end_yr, fn_format='yearwise')
Downloading: rain for year 2010
Downloading: rain for year 2011
Downloading: rain for year 2012
Downloading: rain for year 2013
Downloading: rain for year 2014
Downloading: rain for year 2015
Downloading: rain for year 2016
Downloading: rain for year 2017
Downloading: rain for year 2018
Download Successful !!!
The output is saved in the current working directory. If you want to save the files to a different directory, then you can use following code:
import imdlib as imd

# Downloading 8 years of rainfall data for India
start_yr = 2010
end_yr = 2018
variable = 'rain' # other options are ('tmin'/ 'tmax')
file_dir = (r'C:\Users\imdlib\Desktop\\') #Path to save the files
imd.get_data(variable, start_yr, end_yr, fn_format='yearwise', file_dir=file_dir)
One major purposes of IMDLIB is to process IMD’s gridded dataset. The original data is available in grd file format. IMDLIB can read grd file in xarray style and will create a IMD class objetct.
import imdlib as imd

# Downloading 8 years of rainfall data for India
start_yr = 2010
end_yr = 2018
variable = 'rain' # other options are ('tmin'/ 'tmax')
file_dir = (r'C:\Users\imdlib\Desktop\\') #Path to save the files
data = imd.open_data(variable, start_yr, end_yr,'yearwise', file_dir)
data
<imdlib.core.IMD at 0x13e5b3753c8>
file_dir should refer to top-lev directory. It should contain 3 sub-directories. rain, tmin, and tmax.
if file_dir exist, but no subdirectory, it will try to find the files in file_dir. But be careful if you are using file_format = ‘yearwise’, as it will not differentiate between 2018.grd for rainfall and 2018.grd for tmin.
if file_dir is not given, it will look for the associate subdirectories and files from the current directory.
ds = data.get_xarray()
ds
<xarray.DataArray 'rain' (lat: 129, lon: 135, time: 3287)>
...
...
...
Coordinates:
  * lat      (lat) float64 6.5 6.75 7.0 7.25 7.5 ... 37.5 37.75 38.0 38.25 38.5
  * lon      (lon) float64 66.5 66.75 67.0 67.25 67.5 ... 99.25 99.5 99.75 100.0
  * time     (time) datetime64[ns] 2010-01-01 2010-01-02 ... 2018-12-31
Attributes:
    long_name:  rainfall
    units:      mm/day
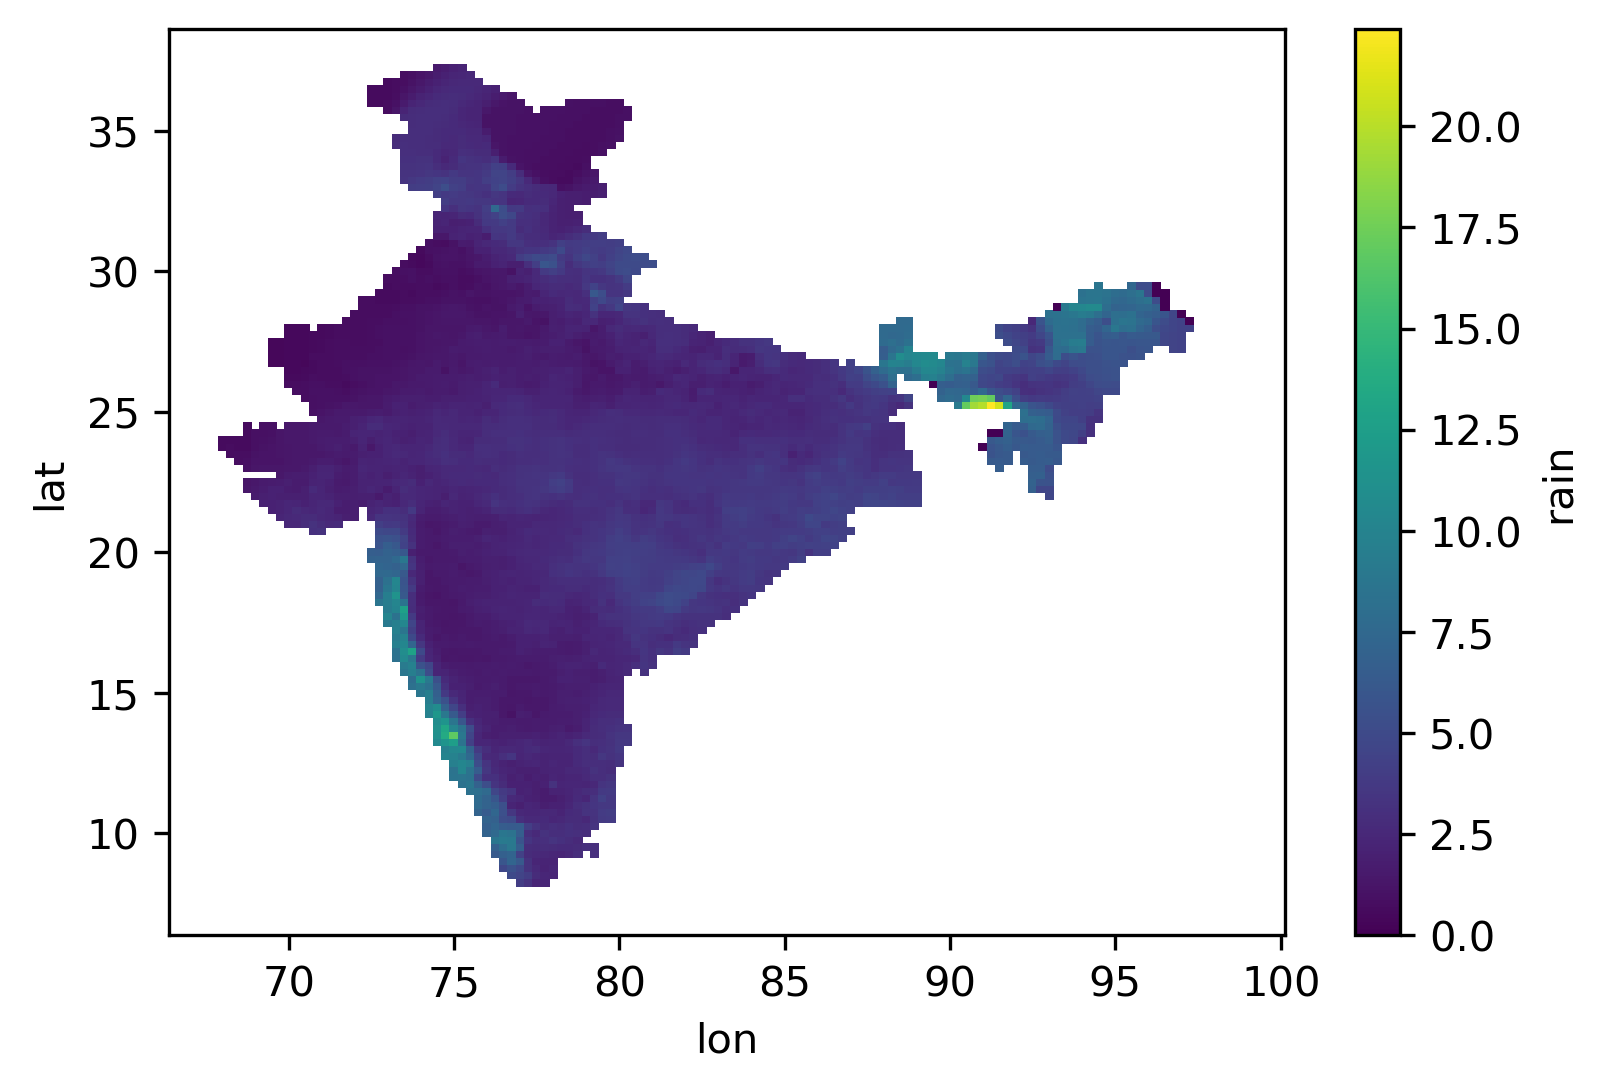
ds.mean('time').plot()
save_nc = (r'C:\Users\imdlib\Desktop\IMD_Rain_2010_2018.nc')
ds.to_netcdf(save_nc)
For more details: https://saswatanandi.github.io/softwares/imdlib/
Source Code: https://github.com/iamsaswata/imdlib